In part 1 of this series post I gave brief explanation on how to install and configure Grafana, how to configure Azure monitor plugin and start collecting data from Azure virtual machines.
In this post I will go through Grafana setup to monitor and visualize data from Unifi controller that is also running in Azure virtual machine on Ubuntu distribution.
Unifi-pooler
Unifi-pooler is small piece of software that is running on virtual machine where Unifi controller is located. It pulls data from the controller and saves it into the InfluxDB database. Grafana then connects to that database, collects data and visualizes it.
Create unifi-pooler account in Unifi
- Go to
Settings -> Admins - Add a read-only user (
unifipoller) with a nice long password. - The new user needs access to each site. For each UniFi Site you want to poll, add admin via the ‘Invite existing admin’ option or in newer versions just select option to inherit to all sites.
- Take note of the username and password, you need to put it into the unifi-poller config file.
Install InfluxDB and create database
First we need to install InfluxDB on Unifi controller
echo "deb https://repos.influxdata.com/ubuntu bionic stable" | sudo tee /etc/apt/sources.list.d/influxdb.list
sudo curl -sL https://repos.influxdata.com/influxdb.key | sudo apt-key add -
sudo apt -y update
sudo apt install -y influxdb
sudo systemctl start influxdb
Than we need to create new database
influx -host localhost -port 8086
CREATE DATABASE unifi
USE unifi
CREATE USER unifipoller WITH PASSWORD 'unifipoller' WITH ALL PRIVILEGES
GRANT ALL ON unifi TO unifipoller
Notice
Make note of the hostname, port, database name, and user/pass for the unifi-poller config file.
Install unifi-pooler
curl -s https://golift.io/gpgkey | sudo apt-key add -
echo deb https://dl.bintray.com/golift/ubuntu bionic main | sudo tee /etc/apt/sources.list.d/golift.list
sudo apt update
sudo apt install unifi-poller
Edit config file
Use your favorite editor
sudo nano /etc/unifi-poller/up.confor if you a hard core command line guru
sudo vi /etc/unifi-poller/up.confYou will want to change these settings
[unifi.defaults]
  url  = "https://your.unifi.controller.ip:8443"
  user = "unifipoller"
  pass = "unifipoller"
[influxdb]
  url  = "http://your.influxdb.ip:8086"
Don’t forget to enter correct username and password and open required ports if you have firewall.
Restart the service
sudo systemctl restart unifi-pollerCheck the log for errors
tail -f -n100 /var/log/syslog /var/log/messages | grep unifi-pollerAdd the data source to Grafana
As in part 1 when we configured Azure monitor as data source, now we need to ad InfluxDB as data source.
- Open the side menu by clicking the Grafana icon in the top header.
- In the side menu under the Dashboards link you should find a link named Data Sources.
- Click the + Add data source button in the top header.
- Select InfluxDB from the Type dropdown.
- Select InfluxQL or Flux from the Query Language list.
Add Unifi dashboards to Grafana
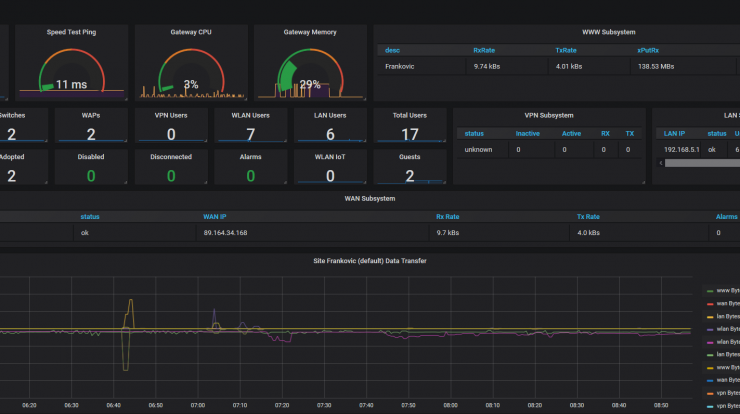
At this point, data is being ingested in InfluxDB and all that is left is to add dashboards to the Grafana interface.
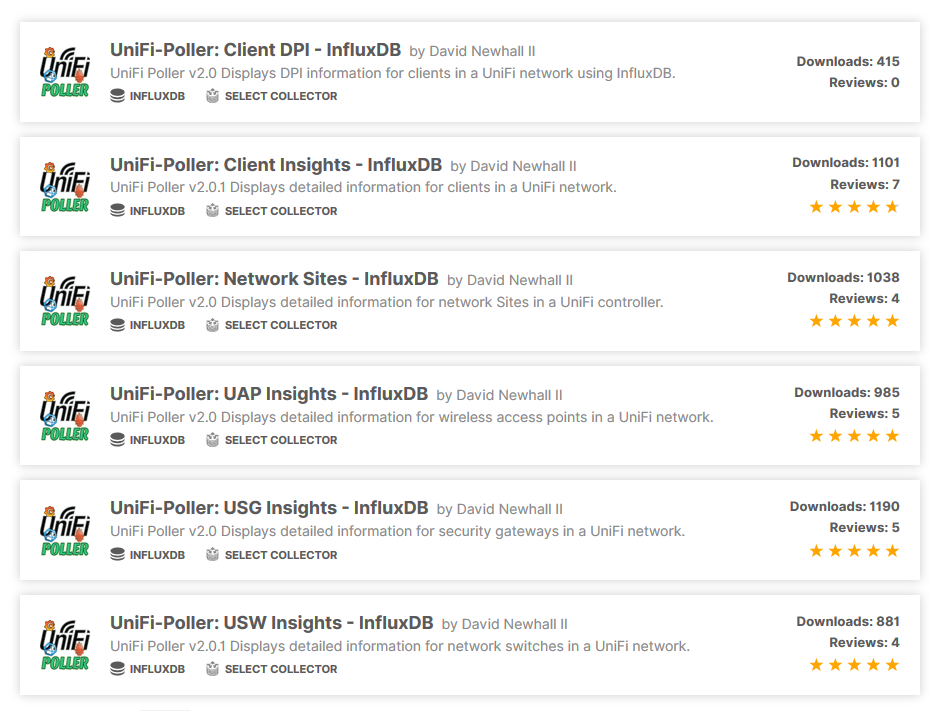
Grafana official repository contains several interesting Unifi dashboards for free. Installation is easy and straightforward as explained in part 1.
Since some of these dashboards contain additional plugins, I recommend you to install them beforehand on Grafana VM.
Clock plugin
grafana-cli plugins install grafana-clock-panelPie-chart plugin
grafana-cli plugins install grafana-piechart-panelRestart Grafana server
service grafana-server restartI had some issues with UniFi-Poller: Client Insights – InfluxDB dashboard because it uses Discrete plugin which installs fine but for some reason does not work in dashboard.

