
For long time now I have been searching for some kind of universal visualization tool that could pull data from many different sources and visualize them in eye pleasing but useful interface.
Ease of use and setup was very important to me, as well as large number of predefined dashboards. Grafana was next in line for trial, and I must say I am very happy how it is working out for me. Fact that there are pre-built images in Azure one also welcome bonus.
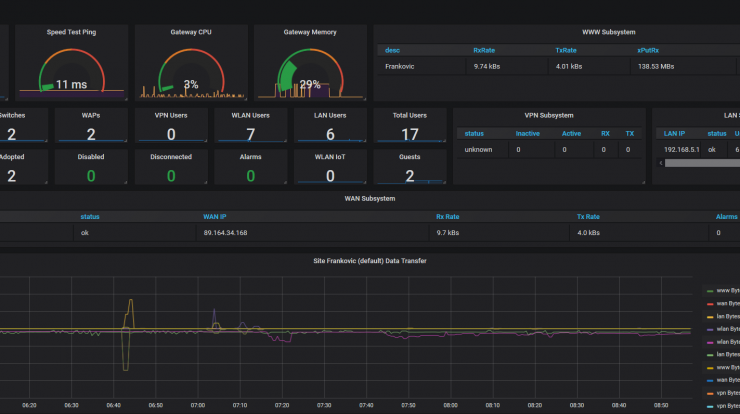
My use case for Grafana is two fold. I want to monitor some home networking and storage equipment such as Unifi switches, access points and gateways and Synology NAS. At the same time I want to access Azure Monitor and Azure Log Analytics data and visualize it in Grafana.
What is Grafana?
Grafana is open source visualization and analytics software. It allows you to query, visualize, alert on, and explore your metrics no matter where they are stored. In plain English, it provides you with tools to turn your time-series database (TSDB) data into beautiful graphs and visualizations.
https://grafana.com/docs/grafana/latest/getting-started/what-is-grafana/
I am using free of charge version which does have some limitations compared to payed one but those where minor for my use case.
Setup Grafana in Azure
I opted to use free official Grafana image from Azure marketplace as it was fastest and easiest way to deploy it. This image is intended to be used for testing and PoC scenarios.
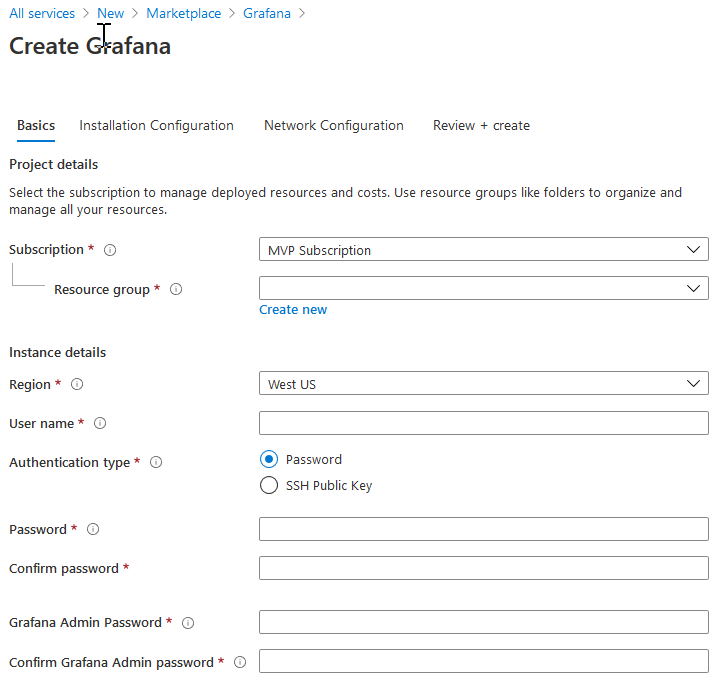
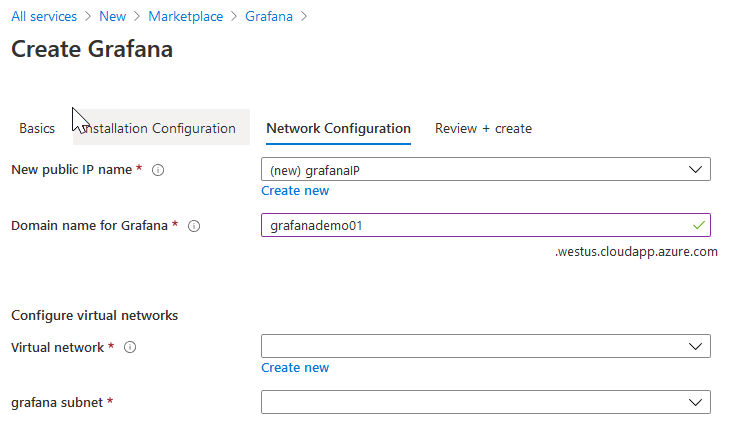
After selecting Create option for Grafana marketplace item we need to fill in couple of attributes and that is it.
Make sure to fill correct values and remember any usernames and passwords. 🙂
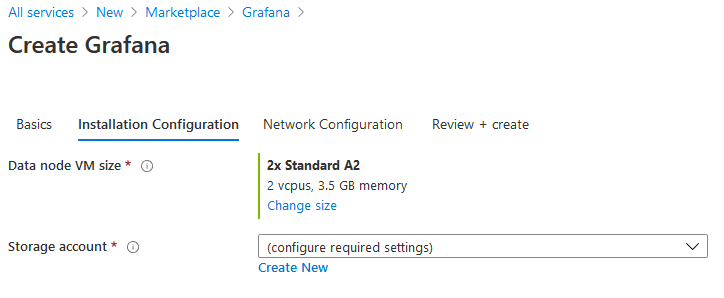
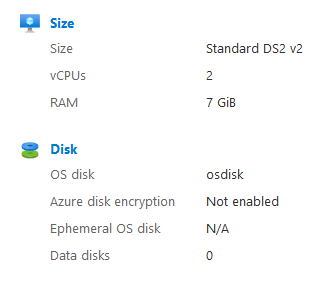
Creating VM and deploying Grafana takes approximately 5 minutes. In my case I selected Standard DS2 v2 virtual machine which is probably overkill for me, but it is just PoC for now and I can reduce its size later on if needed.
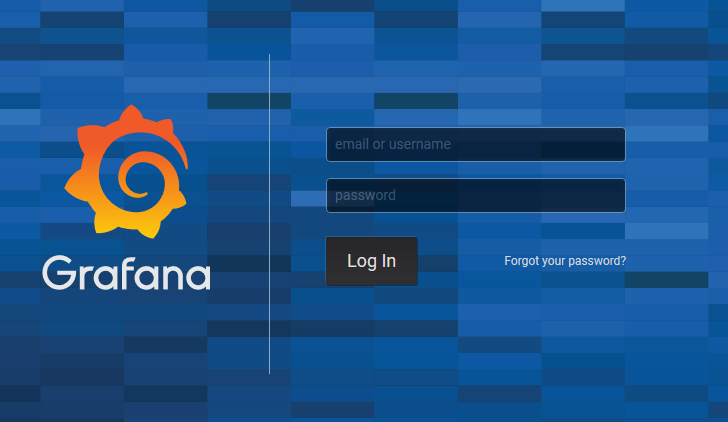
Open http://<your hostname or IP address>:3000 and you will be presented with Grafana login screen. Initial username and password are Admin:Admin if you installed it from scratch. If you used Grafana image from Azure, username is Admin and password you set up in step one of creating VM from image.
Setup Azure monitor data source
There are multiple steps involved and you will have to have sufficient permissions in Azure portal and on Azure AD instance to complete these.
Setup Azure resources
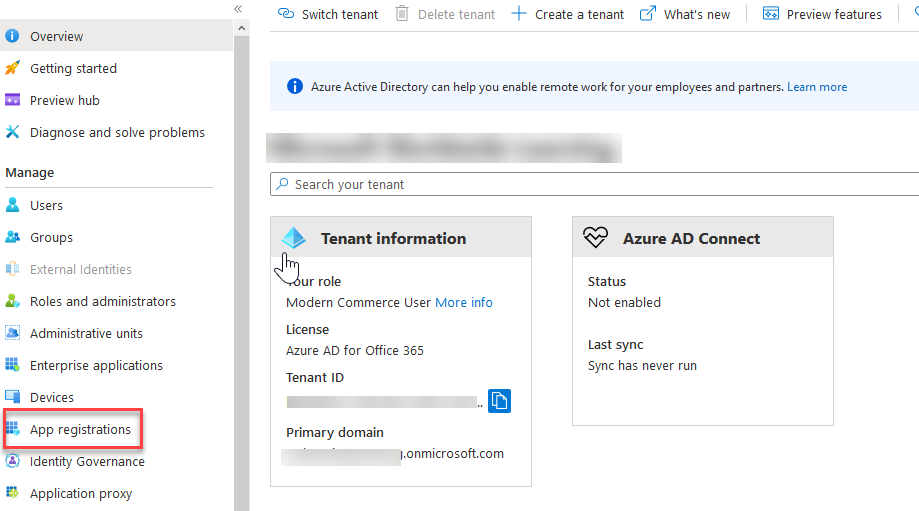
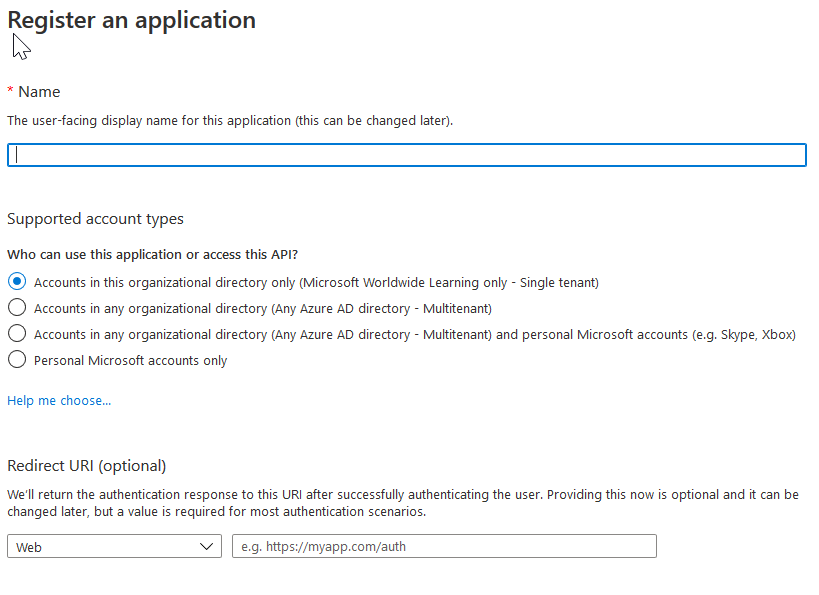
- Go to Azure Portal – Azure Active Directory and select App registrations
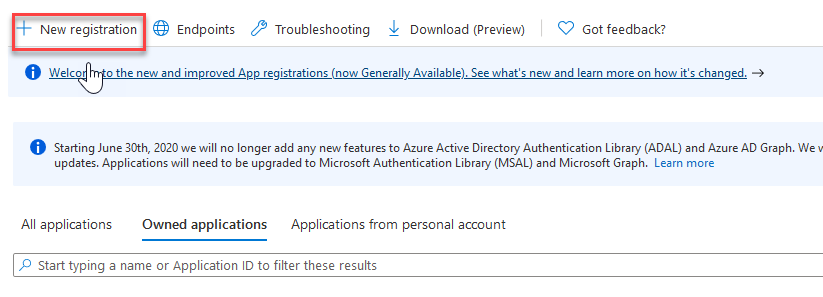
- Select New registration and enter required data
- Give it some meaningfull name
- Leave Supported accounts as is
- For Redirect URI you can enter anything (eg. https://localhost)
- Hit Register
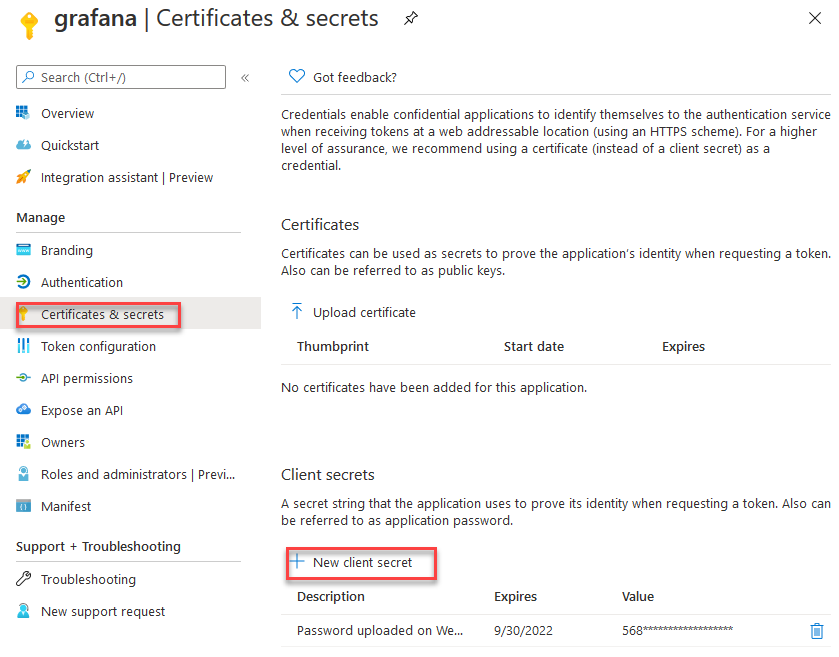
- Go back to App registrations and select your app
- Select Certificates and secrets
- Create new secret
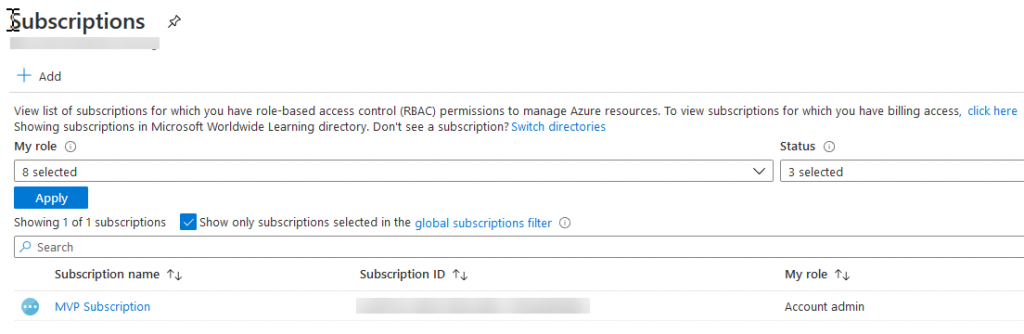
- Select Subscriptions
- Select your subscription
- Select Access control (IAM)
- Add – Add role assignment
- Role – Reader
- In the Select field search for application name you just regstered
- Select Save
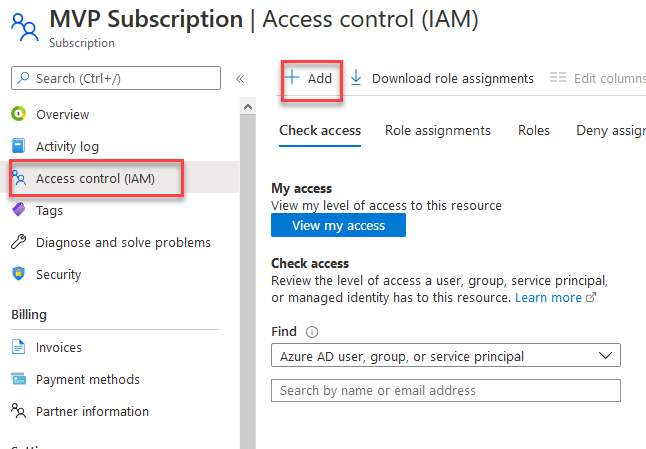
I step 7 we gave our newly registered Azure AD application read access to all resources in our subscription.
Setup Azure monitor data source in Grafana
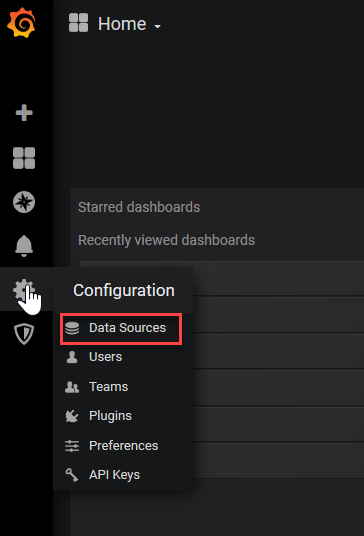
- Open your Grafana admin page and login
- Select Gear wheel and select Data Sources
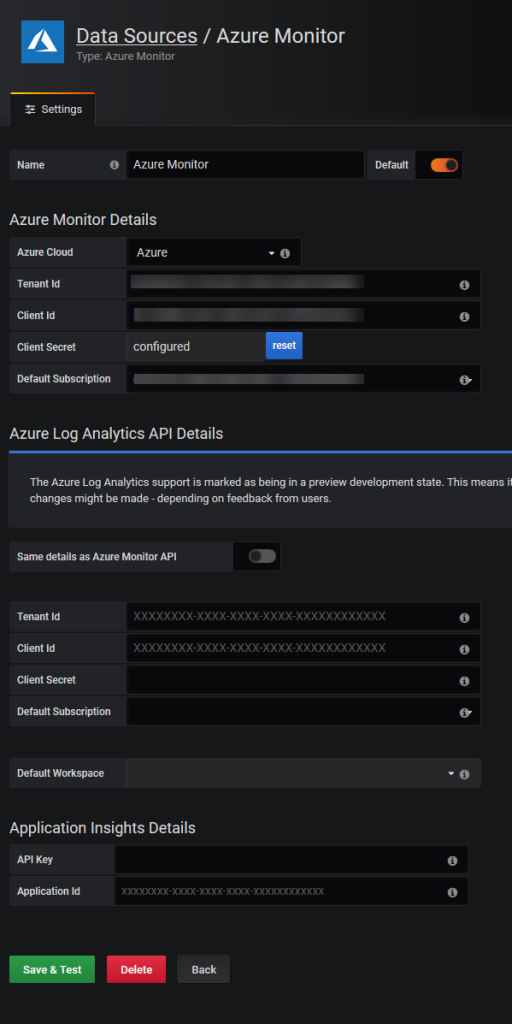
- Select Azure Monitor data source
- Fill in required field for Azure monitor
- Information such as Tenant ID, Client ID can be located in Azure portal where you created your Azure AD application
- Click Save and test
Azure Log Analytics API Details are optional but you can always add them later on.
Considering that your connection was successful, now we can finally add some dashboards to our Grafana.
Visualize Azure VM data in Grafana
Grafana community is very large and there are lots of interesting pre-configured dashboards to choose from. I just did a quick search on Azure topic and got about 30 dashboards.
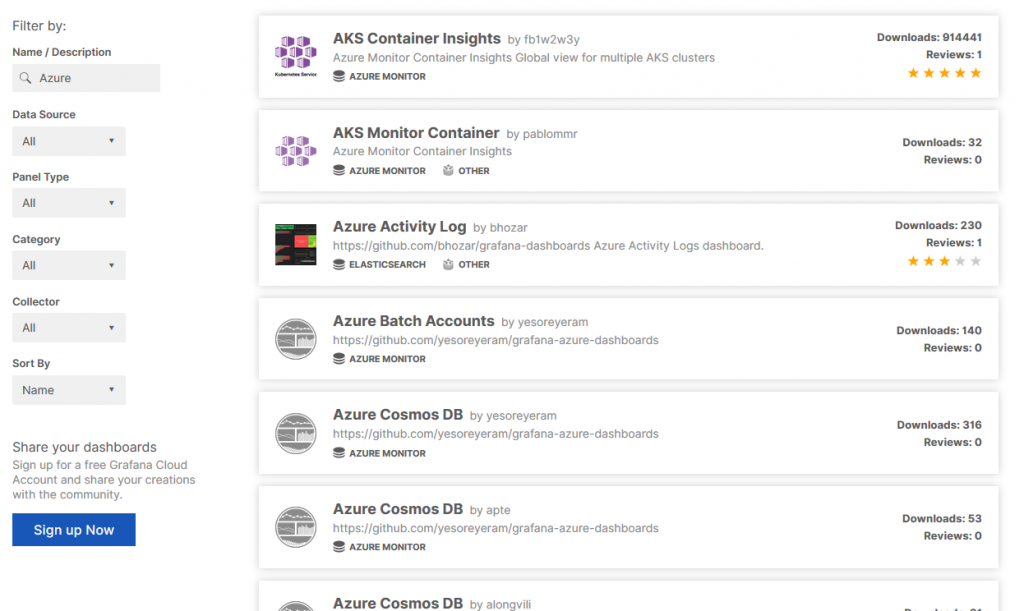
In my case I was interested in Azure Virtual Machineby yesoreyeram.
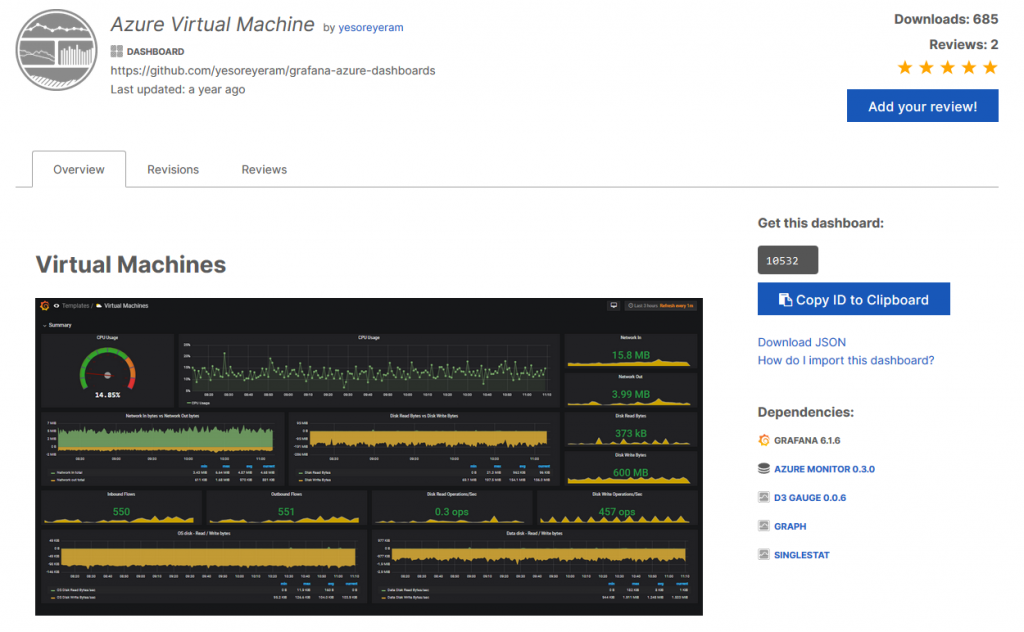
Note the ID of this dashboard as we will need it in next steps.
- Go to Grafana admin page
- Select + sign on the left and select Import
- Paste plugin ID and select Load
- Fill in required fields
At the time of this posting, dashboard had a small error in visualization of CPU Usage gauge. To fix it follow these steps:
- Hover over CPU usage gauge
- In drop down menu select Edit
- On the left select Visualizations if not already selected
- Select Gauge
- On top left select back arrow
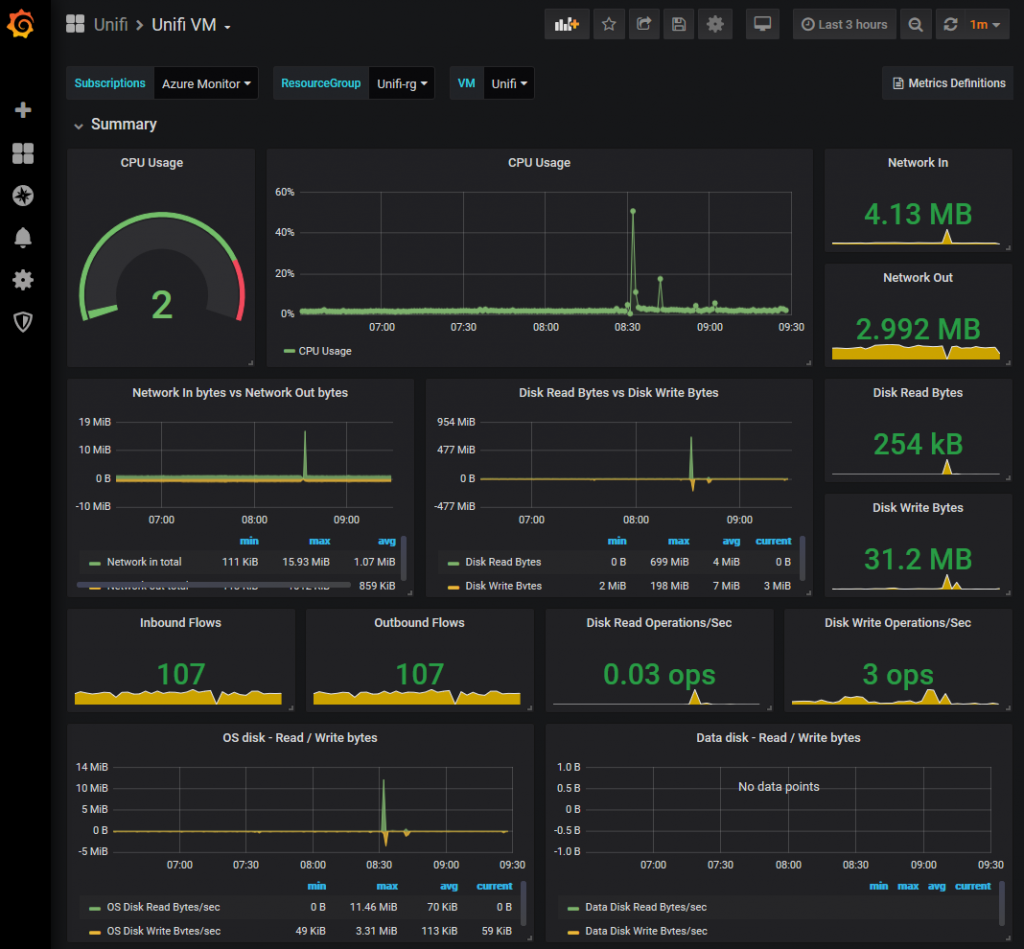
After loading, this dashboard will give you options to choose some parameters such ads Subscription to view, resource group and VMs.

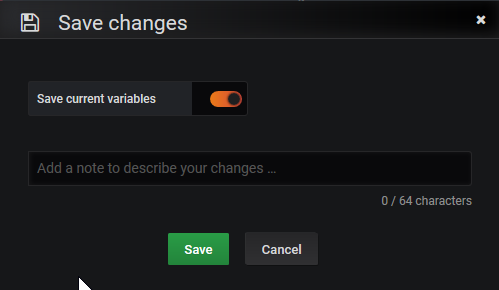
Here you can switch between different attributes. If you want to view same one with same selection of attributes every time you open dashboard, in the top right corner select Save icon and move Save current variables slider to On.
Now, you will have dashboard similar to this one.
In part 2 I will configure monitoring of Unifi devices and how to set up Unifi controller and Grafana to visualize data from all devices.

1 Comment